 Skip to content
 Dissolved oxygen control is one of those process variables that looks simple on paper but causes persistent compliance problems when managed by instinct rather than data. In our experience working with Enhanced Biological Phosphorus Removal (EBPR) systems, DO is the single most common reason plants that are correctly designed still underperform on effluent phosphorus. Get DO wrong in either the anaerobic or aerobic zone — even temporarily — and PAO activity drops in ways that take days to recover. This article explains exactly how DO affects each stage of EBPR and what we recommend for practical control.
How Biological Phosphorus Removal Actually Works
EBPR depends on a specialized group of bacteria called polyphosphate-accumulating organisms (PAOs). Unlike ordinary heterotrophs, PAOs store phosphorus intracellularly as polyphosphate granules, and they do so in a two-stage cycle that requires genuinely distinct redox conditions in sequence.
In the anaerobic phase, PAOs hydrolyze their stored polyphosphate (Poly-P) to generate energy, releasing orthophosphate into solution in the process. Simultaneously, they take up volatile fatty acids (VFAs) from the influent and store them as polyhydroxybutyrate (PHB) inside their cells. This is the energy investment stage — PAOs are essentially charging a battery using stored polyphosphate, which they will redeem in the aerobic phase.
In the aerobic phase, PAOs oxidize their stored PHB using oxygen, generating energy they use to take up phosphorus from solution at rates far exceeding what ordinary microbes can achieve — typically 3–7 mg P per gram VSS per hour under optimal conditions. This luxury uptake is what drives net phosphorus removal from the system: phosphorus accumulates in PAO biomass and leaves the system with the wasted sludge.
The entire mechanism depends on sharp redox separation between the two phases. Compromise either condition — even partially — and the PAO competitive advantage over non-PAO bacteria erodes quickly.
DO Control in the Anaerobic Zone: Lower Than Most Operators Realize
The anaerobic zone DO requirement is strict: ≤ 0.2 mg/L, consistently, not just on average. This is tighter than many plants actually achieve, and the gap between “low DO” and “truly anaerobic” matters enormously for PAO performance.
When DO exceeds 0.2 mg/L in the anaerobic zone, ordinary aerobic heterotrophs outcompete PAOs for the available VFA carbon source. These bacteria don’t need to invest in polyphosphate hydrolysis — they simply oxidize the VFAs directly using the available oxygen. PAOs, which depend on VFA uptake to charge their PHB stores, arrive at the aerobic zone with insufficient internal carbon reserves to drive meaningful phosphorus uptake. The system enters what we call a carbon-limited state: the substrate was consumed in the wrong zone by the wrong organisms.
The equally common — and often overlooked — version of this problem is nitrate intrusion into the anaerobic zone. Nitrate acts as an electron acceptor just as oxygen does. When return sludge carries significant nitrate into the anaerobic zone, denitrifying bacteria consume VFAs using nitrate rather than oxygen, creating a “false anaerobic” condition that depletes PAO substrate without the oxygen alarm signal that would normally prompt operator intervention. This is why return sludge nitrate monitoring matters as much as DO monitoring in EBPR systems.
Practical control targets for the anaerobic zone:
| Parameter | Target | Action if Exceeded |
|---|---|---|
| Dissolved Oxygen | ≤ 0.2 mg/L | Check aeration in preceding zones; inspect for DO carryover in return sludge |
| Return Sludge Nitrate | ≤ 1.5 mg/L NO₃-N | Reduce return ratio or add pre-anoxic zone to consume nitrate before anaerobic stage |
| Return Sludge Ratio | 50–100% of influent flow | Adjust based on nitrate load — lower ratio reduces nitrate intrusion but increases HRT sensitivity |
| Anaerobic HRT | 1.0–2.0 hours | Shorter HRT limits PAO PHB accumulation; extend if VFA uptake appears incomplete |
One practical check we recommend: measure orthophosphate in the anaerobic zone effluent. If phosphorus release is working correctly, you should see orthophosphate rising by 10–30 mg/L above influent levels as PAOs release stored polyphosphate. If the rise is less than 5–8 mg/L, anaerobic conditions are likely compromised by either DO or nitrate intrusion.
DO Control in the Aerobic Zone: Enough, But Not Too Much
The aerobic zone requirement is the opposite of the anaerobic zone — PAOs need adequate oxygen to oxidize PHB and drive phosphorus uptake, but excessive DO carries its own costs.
Target DO in the aerobic zone: 2.0–3.0 mg/L, with a minimum of 1.5 mg/L at the aerobic zone outlet measured during peak load conditions. Below 1.5 mg/L, PAO phosphorus uptake rate drops measurably — studies on full-scale EBPR systems document 15–35% reduction in phosphorus removal efficiency when aerobic DO falls below 1.0 mg/L during peak loading periods. Nitrification also slows below 1.5 mg/L DO, which creates a secondary problem: higher effluent nitrate loads that then recirculate into the anaerobic zone and cause the nitrate intrusion problem described above.
The upper boundary matters too, though it’s less often discussed. Sustained DO above 4.0–5.0 mg/L under low MLSS or light loading conditions accelerates endogenous respiration — microbes consuming their own cell mass rather than substrate — which degrades sludge age management and can contribute to sludge aging over weeks of operation. For most municipal EBPR systems, there’s no performance benefit to running aerobic DO above 3.0 mg/L, and the additional energy cost is straightforward to calculate: blower energy scales approximately linearly with DO setpoint, so dropping from 4.0 to 2.5 mg/L saves roughly 30–35% of aeration energy in the aerobic zone.
Aerobic zone DO optimization steps:
Implement online DO monitoring with closed-loop blower control rather than manual aeration scheduling. Fixed-time aeration programs don’t respond to load variation — diurnal, seasonal, and event-driven load changes all shift the oxygen demand faster than manual adjustment can track. Variable frequency drive (VFD) blowers with DO feedback control consistently achieve tighter DO bands (typically ±0.3 mg/L versus ±1.0–1.5 mg/L for manual control) and reduce aeration energy by 20–40% in documented retrofit projects.
For systems without automatic control, measure DO at least every two hours during peak and off-peak periods for one full week to understand the actual diurnal DO pattern. Most plants find their overnight DO is significantly higher than necessary — a simple blower turndown schedule based on this data often improves sludge health and reduces energy cost without any capital investment.
Coordinating Return Ratio and DO: The Interaction Most Plants Don’t Manage Together
Return sludge ratio and aerobic DO aren’t independent variables in EBPR systems — they interact directly through the nitrate loading pathway into the anaerobic zone. Managing them separately leads to optimization decisions that conflict with each other.
Here’s the practical relationship: higher aerobic DO generally improves nitrification, which increases effluent nitrate concentration. Higher return sludge ratio carries more of that nitrate back into the anaerobic zone. So improving aerobic DO performance without adjusting return ratio — or increasing return ratio without checking aerobic zone nitrate — can inadvertently worsen phosphorus removal even while appearing to improve other parameters.
We recommend a coordinated monitoring approach:
Measure secondary effluent nitrate (NO₃-N) and return sludge DO at least three times weekly, timed to cover both peak and off-peak conditions. If secondary effluent NO₃-N consistently exceeds 5–8 mg/L, the nitrate load entering the anaerobic zone at typical return ratios (50–100%) is likely compromising PAO performance. Options include reducing return ratio (accepting longer sludge blanket management), adding a pre-anoxic chamber before the anaerobic zone to consume nitrate before it contacts PAOs, or reducing aerobic zone DO setpoint if nitrification is exceeding what the denitrification capacity can handle downstream.
Return sludge DO should consistently read < 0.5 mg/L before entering the anaerobic zone. If return sludge carries more DO than that, check whether the secondary clarifier has adequate depth and HRT to allow dissolved oxygen consumption before return, or whether the return pump intake is positioned to avoid oxygenated surface water zones in the clarifier.
FAQ
Q: How do I quickly diagnose whether poor phosphorus removal is caused by DO issues in the anaerobic zone versus insufficient aerobic uptake?
A: Measure orthophosphate at three points: anaerobic zone outlet, aerobic zone inlet, and final effluent. If anaerobic zone orthophosphate is not rising by at least 10 mg/L above influent, the problem is in the anaerobic stage — check DO and nitrate intrusion. If the anaerobic release looks correct but effluent phosphorus is still high, the aerobic uptake is failing — check DO, aerobic HRT, and MLSS condition.
Q: What is the difference between DO control for EBPR versus a conventional activated sludge system without phosphorus removal?
A: Conventional systems typically target DO at 1.5–3.0 mg/L in the aeration zone with no strict anaerobic requirement. EBPR adds a hard constraint: anaerobic zone DO must stay ≤ 0.2 mg/L, and return sludge nitrate must be managed to avoid false anaerobic conditions. The aerobic target is similar but the consequences of going below 1.5 mg/L are more severe in EBPR because nitrification failure feeds back into anaerobic zone performance through nitrate recirculation.
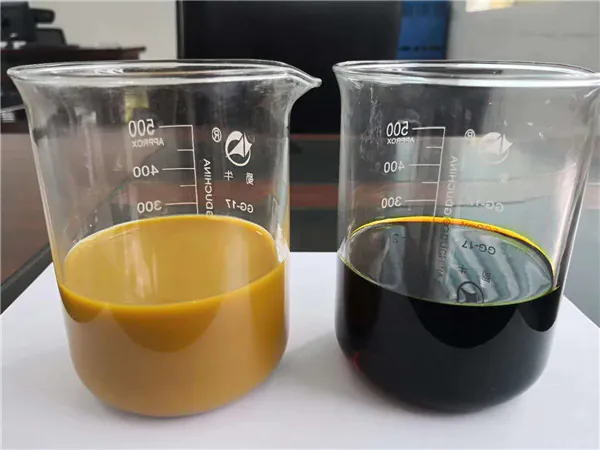
Q: Can chemical phosphorus removal with PAC be used as a backup when EBPR performance drops due to DO control problems?
A: Yes, and we recommend having that capability ready. Polyaluminum chloride (PAC) dosed at 10–30 mg/L as Al in the aerobic zone or before final clarification provides reliable chemical precipitation of orthophosphate regardless of biological performance. It won’t fix the underlying DO control problem, but it protects effluent compliance while biological recovery is underway — recovery from disrupted PAO activity typically takes 5–14 days after conditions are corrected.
DO Control Is the Lowest-Cost Lever for EBPR Performance
Improving DO control in EBPR systems costs far less than adding chemical dosing capacity or retrofitting biological zones. In most cases, implementing online DO monitoring with VFD blower control, tightening return sludge nitrate monitoring, and establishing clear operating targets for each zone is enough to recover 5–15% improvement in phosphorus removal efficiency — without adding a single kilogram of chemical. If your plant is consistently missing effluent phosphorus targets despite correct design, DO control is almost always the right place to start.
If you’re evaluating DO control upgrades or looking for chemical backup options for phosphorus removal compliance, our technical team can review your current process configuration and suggest the most cost-effective path forward. Contact us for a consultation or product recommendations.
