 Skip to content
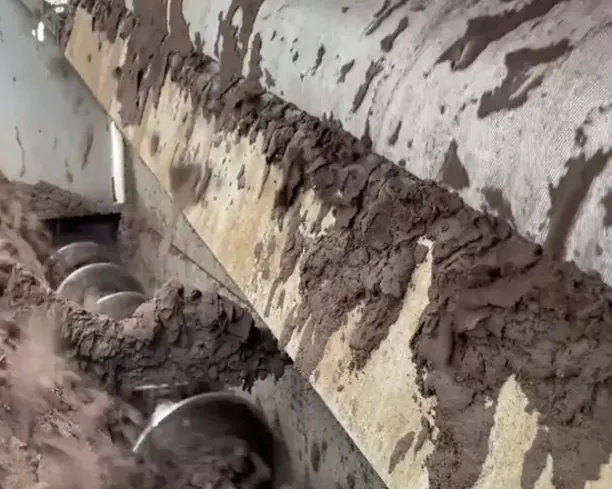
 Sludge handling is one of the largest and most carbon-intensive components of industrial and municipal wastewater treatment operations. Collection, dewatering, transport, and final disposal of wet sludge all carry significant energy and emissions burdens — burdens that scale directly with the volume and moisture content of the sludge produced.
For facilities with carbon reduction targets or Scope 1 and Scope 2 emissions reporting obligations, sludge handling represents both a significant emissions source and one of the most accessible opportunities for measurable reduction. The mechanism is straightforward: better sludge dewatering through optimized PAM conditioning reduces wet sludge volume, which reduces every downstream carbon cost simultaneously.
This guide quantifies the carbon footprint of sludge handling, explains how PAM optimization reduces it, and provides a framework for calculating and reporting emissions reductions from dewatering improvement.
The Carbon Cost of Wet Sludge
Before optimizing, it helps to understand where the carbon emissions in sludge handling actually come from.
Sludge handling emissions arise from four primary sources:
Mechanical dewatering energy: Centrifuges, belt presses, and filter presses all consume electricity. Energy consumption per tonne of dry solids processed increases when sludge is poorly conditioned — the equipment runs longer or at higher intensity to achieve target throughput, consuming more energy per unit of dry solids output.
Transport emissions: Wet sludge is predominantly water. A sludge cake at 75% moisture is three parts water for every one part dry solids — meaning three quarters of every transport load is water weight. Reducing moisture from 75% to 60% reduces transport weight by approximately 37% for the same dry solids throughput, with a proportional reduction in transport fuel consumption and emissions.
Disposal emissions: Landfill disposal of wet sludge generates methane from anaerobic decomposition of organic material — a potent greenhouse gas with a Global Warming Potential 28 times that of CO₂ over a 100-year period. Incineration of wet sludge requires supplementary fuel because the high moisture content reduces the calorific value of the feed — increasing combustion emissions per tonne of dry solids destroyed.
Auxiliary systems: Pumping wet sludge through collection and transfer systems, operating thickener rake drives, and maintaining preparation and dosing equipment all contribute to the facility’s overall energy consumption.
How PAM Optimization Reduces Sludge Carbon Emissions
Reducing Cake Moisture Content
The primary carbon reduction mechanism is simple: drier cake has lower mass for equivalent dry solids content, reducing transport and disposal volume — and the associated emissions — proportionally.
The relationship between cake moisture and wet cake volume follows a straightforward calculation:
For a stream producing 10 tonnes of dry solids per day:
- At 75% moisture: wet cake volume = 10 ÷ (1 – 0.75) = 40 tonnes/day
- At 60% moisture: wet cake volume = 10 ÷ (1 – 0.60) = 25 tonnes/day
- Reduction: 15 tonnes/day less wet cake — a 37.5% volume reduction
At a transport emission factor of 0.15 kg CO₂ per tonne-kilometre and a 50 km disposal distance:
- 40 tonnes × 50 km × 0.15 = 300 kg CO₂/day at 75% moisture
- 25 tonnes × 50 km × 0.15 = 187.5 kg CO₂/day at 60% moisture
- Transport emission saving: 112.5 kg CO₂/day = approximately 41 tonnes CO₂/year
For larger operations or longer transport distances, the saving scales proportionally.
Improving Solids Capture Efficiency
Better PAM conditioning improves solids capture efficiency in centrifuges — the proportion of dry solids retained in the cake rather than passing into the centrate. Poor conditioning allows fine biological solids to pass back to the liquid stream, requiring additional treatment and generating additional sludge in subsequent cycles.
Improving centrifuge capture from 92% to 97% reduces the recirculating solids load significantly — lowering overall sludge production, reducing dewatering energy consumption, and cutting the emissions associated with processing the recirculated fraction.
Enabling Beneficial Reuse Pathways
Sludge cake below approximately 25% moisture is suitable for land application as a biosolids amendment in most regulatory frameworks — diverting material from energy-intensive disposal pathways to a beneficial reuse pathway with positive soil carbon value.
The carbon benefit of land application versus landfill is significant: landfill generates methane emissions from decomposing organics, while land application sequesters a portion of the organic carbon in soil and avoids the methane generation pathway entirely.
PAM conditioning that achieves target moisture for land application eligibility therefore delivers a carbon benefit beyond the transport saving — it changes the disposal pathway itself.
Contact our technical team today to assess your current dewatering performance and identify the carbon reduction potential from PAM optimization. → Contact our technical team today
Quantifying Carbon Savings: A Calculation Framework
For facilities reporting Scope 1 and Scope 2 emissions, the following framework enables carbon savings from PAM-driven dewatering improvement to be calculated and reported:
Step 1: Establish baseline sludge production Record current wet sludge production (tonnes/day) and cake moisture content (%) over a representative period — ideally 30 days.
Step 2: Calculate dry solids throughput Dry solids (tonnes/day) = Wet sludge (tonnes/day) × (1 – moisture fraction)
Step 3: Project improved cake moisture Based on jar testing or supplier performance data, estimate achievable cake moisture with optimized PAM conditioning.
Step 4: Calculate reduced wet sludge volume New wet sludge (tonnes/day) = Dry solids ÷ (1 – improved moisture fraction)
Step 5: Calculate transport emission reduction Emission saving (kg CO₂/day) = (Baseline wet sludge – Improved wet sludge) × transport distance (km) × emission factor (kg CO₂/tonne-km)
Step 6: Calculate dewatering energy reduction Estimate energy saving from reduced press or centrifuge operating hours using equipment-specific energy consumption data.
Step 7: Annualize and report Multiply daily savings by 365 (or operating days per year). Express as tonnes CO₂-equivalent for Scope 1/2 reporting.
This framework produces defensible, auditable carbon savings data suitable for GRI 305, CDP Climate, or internal sustainability reporting.
Selecting PAM Grades for Maximum Dewatering Performance
Not all PAM grades deliver equivalent dewatering improvement. Grade selection for carbon-reduction-focused dewatering optimization follows the same principles as performance-focused selection — but with cake moisture content as the primary metric rather than cost per kilogram.
For belt press applications: Medium charge density cationic PAM (30–50%) at high molecular weight (12–18 million Daltons) produces the open floc structure needed for gravity drainage in the belt press gravity zone before roller compression. The target is maximum drainage before mechanical pressure is applied.
For centrifuge applications: Higher charge density cationic PAM (50–80%) at medium molecular weight (8–14 million Daltons) provides rapid, strong binding to biological and organic solids before the centrifuge applies separation force. Emulsion form often outperforms powder in high-speed centrifuge applications due to faster dispersion.
For filter press applications: Medium charge density (30–60%) at higher molecular weight (14–18 million Daltons) produces cake structure that maintains filtration channels under press pressure — the key to low final moisture content in filter press applications.
For broader grade selection guidance, see: Choosing the Right PAM Grade for Your Industry
Frequently Asked Questions
How much CO₂ reduction is realistically achievable through PAM dewatering optimization?
The answer depends on current cake moisture, dry solids throughput, transport distance, and disposal method. For a mid-size municipal treatment plant producing 20 tonnes of dry solids per day with a 50 km disposal distance, reducing cake moisture from 78% to 68% typically saves 50–80 tonnes CO₂ per year from transport alone, plus additional savings from reduced disposal energy and potential methane avoidance from landfill diversion.
Can we include PAM-driven carbon savings in our Scope 1 and Scope 2 emissions reporting?
Transport emission reductions from lower sludge volume are typically Scope 3 emissions reductions for the generating facility — they occur in the transport and disposal supply chain rather than at the facility itself. Dewatering energy reductions are Scope 2 reductions if the electricity source is grid power. Internal combustion equipment used in sludge handling contributes to Scope 1. Classify savings correctly against GHG Protocol categories for accurate reporting.
Does PAM itself have a significant carbon footprint that offsets the savings?
PAM manufacturing has a carbon footprint primarily from energy use in polymerization and acrylamide monomer production. However, the carbon cost of PAM used in typical treatment applications is small relative to the transport and disposal carbon savings it enables. A rough estimate: 1 kg of PAM polymer has an embodied carbon of approximately 3–5 kg CO₂-equivalent; the transport carbon saving from using that kilogram to dewater sludge more effectively is typically 10–50 times larger, depending on disposal distance and moisture improvement achieved.
Conclusion
Sludge handling is a significant and reducible source of carbon emissions in industrial and municipal wastewater treatment. The mechanism for reduction is direct: better PAM conditioning produces drier cake, which reduces transport weight, lowers disposal energy, and in many cases enables beneficial reuse pathways that avoid the methane emissions of landfill disposal entirely.
The carbon savings are quantifiable, reportable, and achievable without capital investment in new infrastructure. For facilities with Scope 1, Scope 2, or Scope 3 emissions targets, PAM-driven sludge dewatering optimization represents one of the most accessible and cost-effective carbon reduction levers in the treatment operation.
Ready to quantify the carbon savings from improved sludge dewatering at your facility? Contact our technical team today for a dewatering assessment and emissions reduction calculation. → Get in touch today
