 Skip to content
 Written by the HyChron Technical Team — water treatment specialists with over 15 years of field experience in municipal and industrial systems. Last reviewed: April 2026
If you are evaluating a new PAC product, switching suppliers, or troubleshooting inconsistent treatment results, the jar test is the only tool that gives you reliable, comparable data. Everything else — supplier claims, published performance tables, other plants’ results — is useful context but not a substitute for testing your own water with your own candidate product.
This article explains how to design and conduct a jar test specifically for PAC selection and evaluation, how to interpret the results correctly, and how to translate jar test findings into full-scale operational settings.
What a Jar Test Actually Tells You
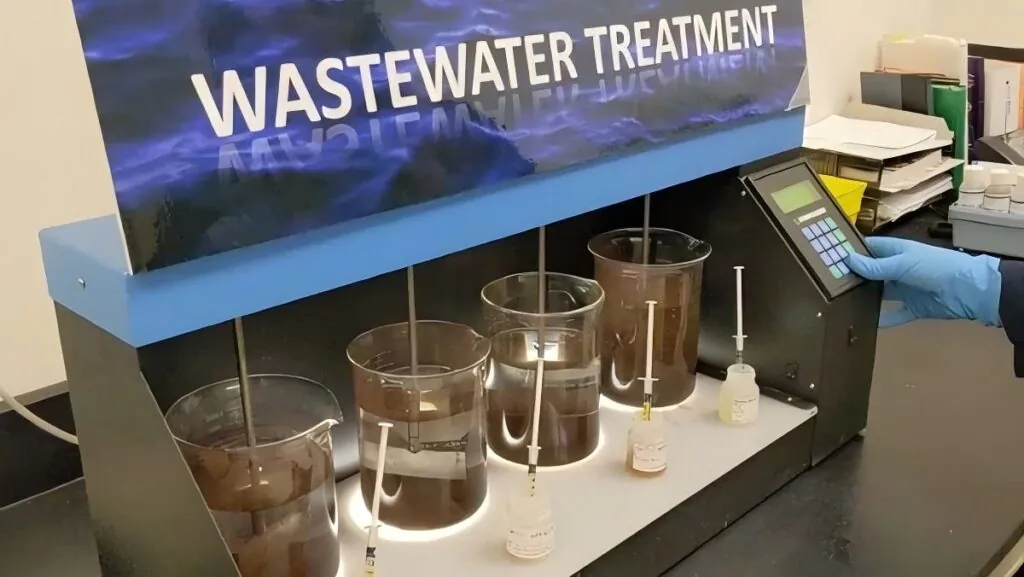
A jar test simulates the coagulation-flocculation-sedimentation process at bench scale, allowing you to evaluate PAC products under controlled, comparable conditions using your actual raw water.
Done correctly, a jar test tells you:
- The optimal PAC dose for your current raw water
- The dose-response relationship (how performance changes with dose)
- The charge reversal point (the dose above which performance deteriorates)
- How different PAC products compare under identical conditions
- How pH adjustment affects coagulation performance
- Whether PAM addition improves results at your optimal PAC dose
Done incorrectly — with unrepresentative samples, wrong mixing conditions, or misread results — a jar test produces misleading data that leads to wrong dosage settings and poor full-scale performance.
Step-by-Step Jar Test Procedure for PAC Evaluation
Equipment Required
- Six-position jar test apparatus (gang stirrer) with variable speed control
- Six 1,000 mL beakers or square jars
- Calibrated turbidity meter (nephelometer)
- pH meter
- Pipettes and graduated cylinders for accurate chemical dosing
- Timer
Sample Collection
Raw water samples must be representative of the conditions you are optimizing for. Key considerations:
- Collect samples during the treatment period most relevant to your optimization goal — high turbidity events, cold weather periods, or typical baseline conditions depending on your priority
- Test within 30 minutes of collection for most accurate results
- If same-day testing is not possible, refrigerate at 4°C and test within 24 hours — do not freeze
- Collect at least 8 liters to allow for replicate testing
PAC Stock Solution Preparation
Prepare a PAC stock solution at 1% w/v (1 g/100 mL) using the product to be evaluated:
- Weigh 1.0 g of powder PAC (or measure equivalent volume of liquid PAC)
- Dissolve in 100 mL of distilled water
- At this concentration, 1 mL added to 1,000 mL of sample = 10 mg/L PAC dose
This 1:1 mL-to-mg/L relationship simplifies dosing calculations significantly.
Test Design
For initial product evaluation, test at six dose levels spanning the expected optimal range:
Low turbidity water (< 20 NTU): 2, 5, 10, 15, 20, 30 mg/L Moderate turbidity water (20–100 NTU): 5, 10, 20, 30, 50, 70 mg/L High turbidity water (> 100 NTU): 10, 20, 40, 60, 80, 100 mg/L
Mixing Protocol
- Fill all six jars with 1,000 mL of raw water sample
- Set stirrer to rapid mix speed: 200–250 rpm (approximately G = 200–300 s⁻¹)
- Add PAC to each jar simultaneously and start the timer
- Rapid mix for 60 seconds
- Reduce speed to slow mix: 30–40 rpm (approximately G = 20–40 s⁻¹)
- Slow mix for 20 minutes
- Stop stirring and allow to settle for 30 minutes without disturbance
- Collect supernatant from each jar (withdraw from 5 cm below the surface)
- Measure turbidity, pH, and color of each supernatant
Reading the Results
Plot dose (x-axis) versus effluent turbidity (y-axis). A well-behaved dose-response curve shows:
- Decreasing turbidity from low dose to the optimum — charge neutralization improving
- Minimum turbidity at the optimal dose
- Increasing turbidity above the optimum — charge reversal beginning
The optimal PAC dose is the dose at the turbidity minimum. Your operational dosage should be set 10–15% below the charge reversal point — at the optimal dose with a safety margin.
Comparing Two PAC Products Head-to-Head
When evaluating a new supplier’s PAC against your current product:
- Run both products in parallel jar tests using the same raw water sample collected at the same time
- Test the same dose range for both products
- Compare the dose-response curves — not just the minimum turbidity, but the full shape of the curve
- Note: a product with a wider dose range before charge reversal gives operators more flexibility in varying conditions
- Compare floc characteristics — floc size, settling speed, and supernatant clarity at equivalent doses
What to measure for a complete comparison:
- Effluent turbidity at each dose
- Effluent pH (residual alkalinity)
- Settling rate (observe visually — time to first visible clearing)
- Floc size and compactness
- Residual aluminum (for drinking water applications)
Adjusting for pH and Temperature
pH adjustment test: Run a separate jar test series at your optimal PAC dose, varying raw water pH before dosing (e.g., pH 5.5, 6.5, 7.0, 7.5, 8.0, 8.5). This identifies whether pH adjustment before PAC dosing would improve performance — and what the optimal pH is for your specific water and product.
Temperature test: If evaluating cold-weather performance, conduct jar tests at the lowest expected winter water temperature (use refrigerated samples). Compare dose requirements and floc quality at low and normal temperature. This data determines whether dosage or flocculation time needs to change in winter.
For pH management guidance: Impact of pH on PAC Performance For temperature effects: Temperature Effects on PAC Treatment
Translating Jar Test Results to Full-Scale Operation
Jar test results require adjustment before applying to full-scale systems. Key differences:
| Parameter | Jar Test | Full Scale |
|---|---|---|
| Flash mixing G-value | ~200–300 s⁻¹ at 200–250 rpm | Target 200–400 s⁻¹ |
| Flocculation G-value | ~20–40 s⁻¹ at 30–40 rpm | 20–60 s⁻¹ |
| Flocculation time | 20 minutes | 15–30 minutes (extend in cold weather) |
| Settling time | 30 minutes | Depends on clarifier design |
If full-scale G-values differ significantly from jar test conditions, expect some performance difference. Higher full-scale flash mixing energy generally improves performance. Lower flocculation energy (if within range) is acceptable. Shorter flocculation time than the jar test may reduce floc size and settling efficiency.
For mixing optimization guidance: Optimizing PAC Mixing and Reaction Time
Frequently Asked Questions
How many jar tests do I need to run before switching to a new PAC supplier?
A minimum of three jar tests under different raw water conditions — baseline conditions, high-turbidity conditions, and cold-weather conditions if relevant — provides sufficient data for a reliable supplier evaluation. Single-condition testing risks selecting a product that performs well under one set of conditions but poorly under others.
Can I use jar test data to compare PAC with PAM combination performance?
Yes. After identifying the optimal PAC dose, run a second jar test series at that fixed PAC dose with increasing PAM doses (0.5, 1.0, 1.5, 2.0, 3.0 mg/L). This shows whether PAM addition meaningfully improves performance for your specific water and how much PAM is needed.
My jar test shows good results but our supplier says their product needs a higher dose — what should I trust?
Trust your jar test results with your water. Supplier dosage recommendations are necessarily generic — they cannot be calibrated to your specific raw water chemistry, temperature, and treatment targets. The jar test with your water is always more reliable than a published guideline.
Conclusion
The jar test is the foundation of reliable PAC selection and dosage optimization. It cannot be replaced by supplier data, published tables, or estimates — because no published data accounts for the specific combination of raw water chemistry, temperature, and treatment targets at your facility.
Conducted correctly and interpreted carefully, a jar test provides the data needed to select the best PAC product for your application, set the optimal operational dose, and predict full-scale performance before committing to full-scale changes.
Contact our technical team for jar testing support, PAC product samples for evaluation, and guidance on translating your jar test results into full-scale dosage settings. We respond within 24 hours.
