Written by the HyChron Technical Team — water treatment specialists with over 15 years of field experience in municipal and industrial systems. Last reviewed: April 2026
The question most procurement managers ask when considering PAC is: “How long until we recover the higher unit cost?” It is the right question — but it often gets answered with incomplete data, because the savings calculation stops at chemical purchase cost and ignores the larger savings from sludge, pH adjustment, and equipment maintenance.
This article provides a complete ROI framework for switching to high-quality PAC — including all relevant cost categories, realistic payback timelines, and a worked example you can adapt for your own plant.
What “High-Quality PAC” Means for ROI Purposes
Not all PAC products deliver the same ROI. The cost advantage of PAC over alum — and the ROI calculation — depends on the PAC product’s actual performance, which is determined by:
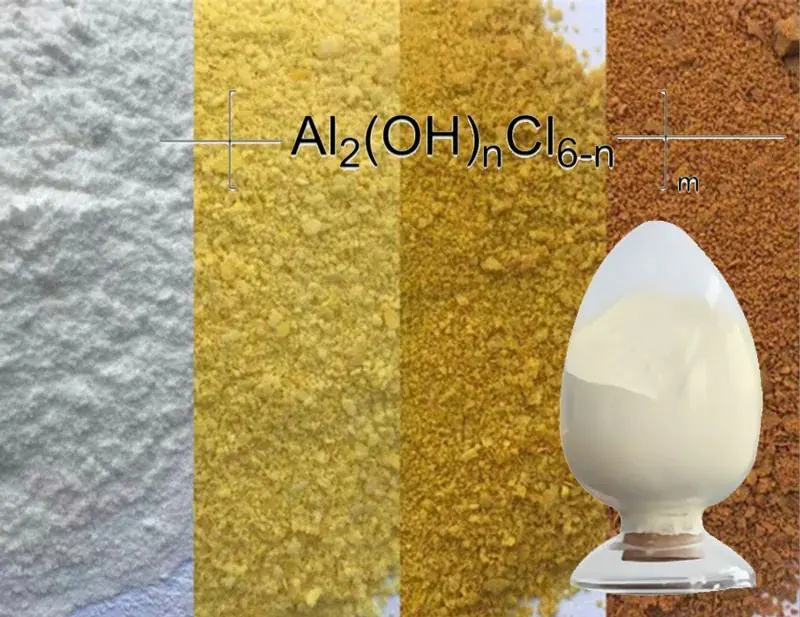
- Al₂O₃ content (higher = more active ingredient per kg, lower effective dosage)
- Basicity (higher basicity = more efficient charge neutralization, lower dose for equivalent performance)
- Batch consistency (inconsistent products require higher safety margins in dosing, increasing effective consumption)
A low-quality PAC with 60% basicity and inconsistent Al₂O₃ content may require dosages only 10–20% lower than alum — delivering a weak ROI. A high-quality PAC with 75–80% basicity and verified Al₂O₃ content achieves 35–50% lower dosage — delivering a strong ROI that justifies the premium unit price.
The ROI Calculation Framework
Investment (Cost Increase)
1. Higher chemical unit cost: Annual chemical cost increase = (PAC unit price − Alum unit price) × Annual PAC consumption (kg)
Note: Annual PAC consumption (kg) = PAC dose (mg/L) × Annual flow (m³) / 1,000
2. Transition costs (one-time):
- Jar testing to establish optimal PAC dose: minimal (laboratory time only)
- Operator training on new chemical handling: 1–2 days
- Dosing pump recalibration: minimal
- Storage tank modifications: usually none — PAC is compatible with standard HDPE tanks
Total transition cost is typically small — rarely exceeding a few thousand dollars for most plants.
Return (Cost Savings)
1. Sludge disposal saving: Annual saving = (Alum sludge volume − PAC sludge volume) × Disposal cost per tonne
2. pH adjustment chemical saving (if applicable): Annual saving = Current annual pH adjustment chemical cost × Fraction eliminated by PAC
3. Equipment maintenance saving: Annual saving = Current annual corrosion-related maintenance cost × Reduction factor (estimate 30–60% reduction)
4. Extended filter run saving (if applicable): Annual saving = Reduction in backwash frequency × (Backwash water cost + Pump energy cost) per event
5. Biological treatment energy saving (CEPT applications): Annual saving = Reduction in aeration energy × Energy cost per kWh
Worked Example: Medium Municipal Plant
Plant parameters:
- Treatment flow: 8,000 m³/day
- Current coagulant: alum at $0.18/kg, dose 38 mg/L
- Current sludge disposal: $130/tonne, 1.1 tonnes/day
- pH adjustment chemicals (lime): $8,000/year
- Annual alum chemical cost: 38 × 8,000 × 365 / 1,000 × $0.18 = $19,994/year
Switching to high-quality PAC:
- PAC unit price: $0.32/kg, dose 22 mg/L (42% lower dose)
- Annual PAC chemical cost: 22 × 8,000 × 365 / 1,000 × $0.32 = $20,531/year
Cost comparison:
| Category | Alum System | PAC System | Annual Saving |
|---|---|---|---|
| Coagulant purchase | $19,994 | $20,531 | −$537 (PAC slightly higher) |
| Sludge disposal (42% less sludge) | $52,195 | $30,273 | +$21,922 |
| pH adjustment chemicals | $8,000 | $0 | +$8,000 |
| Equipment maintenance (est.) | $6,000 | $2,500 | +$3,500 |
| Total annual cost | $86,189 | $53,304 | +$32,885 |
Annual saving: $32,885 One-time transition cost: ~$1,500 (jar testing, training, recalibration) Simple payback period: less than 3 weeks
ROI Scenarios by Plant Scale
| Plant Scale | Daily Flow | Estimated Annual Saving | Simple Payback |
|---|---|---|---|
| Small plant | 1,000 m³/day | $5,000–$12,000 | 2–6 weeks |
| Medium plant | 5,000–10,000 m³/day | $20,000–$50,000 | 1–3 weeks |
| Large plant | 50,000+ m³/day | $150,000–$400,000+ | < 1 week |
| Industrial WW | 2,000 m³/day | $8,000–$25,000 | 2–5 weeks |
Estimates based on typical dosage reduction, sludge disposal at $120–180/tonne, and moderate pH and maintenance savings.
Why ROI Is Higher with High-Quality PAC
The ROI difference between high-quality and standard-quality PAC products is not marginal — it is substantial:
Standard-quality PAC (60% basicity, inconsistent batches):
- Typical dosage reduction vs alum: 15–25%
- Lower sludge reduction: 15–25%
- ROI: modest — often requires careful analysis to confirm positive return
High-quality PAC (75–80% basicity, verified consistent batches):
- Typical dosage reduction vs alum: 35–50%
- Larger sludge reduction: 35–50%
- ROI: strong — typically demonstrates positive return within weeks
The difference in basicity translates directly into the dosage reduction, which drives the sludge saving, which is the largest single component of the ROI calculation for most plants.
For basicity comparison: High Basicity PAC vs Low Basicity PAC For sludge production detail: Sludge Production When Using PAC
Frequently Asked Questions
How do I build a business case for switching to PAC within my organization?
Use the five-category cost framework in this article with your plant’s actual data — current alum dose (confirmed by jar test), current disposal costs, current pH adjustment costs, and current maintenance budget. Present the analysis as annual cost comparison (not unit price comparison) and include the simple payback calculation. For most plants, the numbers make a compelling case without any optimistic assumptions.
What if our PAC supplier cannot provide consistent quality between batches?
Batch inconsistency is the biggest risk in PAC procurement. If basicity or Al₂O₃ content varies significantly between batches, effective dosage requirements vary accordingly — eroding the cost advantage. Always require COA documentation for every batch, and periodically verify with independent laboratory testing. Our products ship with full batch COA and maintain tight specification tolerances across deliveries.
Should I switch to PAC immediately, or run a pilot test first?
For most plants, a pilot test (parallel jar testing of PAC and alum, followed by a 2–4 week trial at reduced scale or on one treatment train) provides sufficient confidence before full commitment. This approach limits risk while generating the actual dosage and performance data needed for a reliable ROI calculation.
Conclusion
The ROI of switching to high-quality PAC is typically measured in weeks, not years. The combination of dosage reduction, sludge savings, and eliminated pH adjustment costs delivers annual savings that substantially exceed the chemical unit price premium — consistently and from the first treatment cycle after switching.
The key is selecting a high-quality product with verified basicity and Al₂O₃ content, conducting proper jar testing to establish the optimal dose, and calculating ROI on total treatment cost per cubic meter rather than unit price per kilogram.
Contact our technical team today for a free customized ROI calculation for your plant, based on your actual flow, costs, and water quality data. We respond within 24 hours.